Live workflow execution visualization: why users need to see what is happening

Workflow visualization has been treated as a developer feature – log timelines, event histories, debug panels for engineers operating workflows in production. But the people most affected by what a workflow does are the end users running them. Showing those users a live, on-canvas view of what their workflow is doing – in real time, on the same canvas they used to author it – is the part of the product where trust gets built.
Every workflow product makes a promise. A user authors a graph. The graph runs. Something happens at the end. The product’s job is to make the middle of that sentence – the graph runs – feel knowable. Not to engineers, who can read logs. To the user who built the workflow and is waiting on the result.
The way most products handle this is with an after-the-fact summary. A run completes (or fails), the user gets a notification, and a status page shows “succeeded” or “failed” with maybe a list of step durations. This is the minimum viable answer. It is also the answer that loses customer trust the first time something goes sideways and the user has no idea what their workflow was doing for the last six hours.
Live execution visualization is the better answer. It is also harder to build well, and the design choices made along the way determine if the feature feels like product magic or product clutter.
Workflow visualization is not one thing
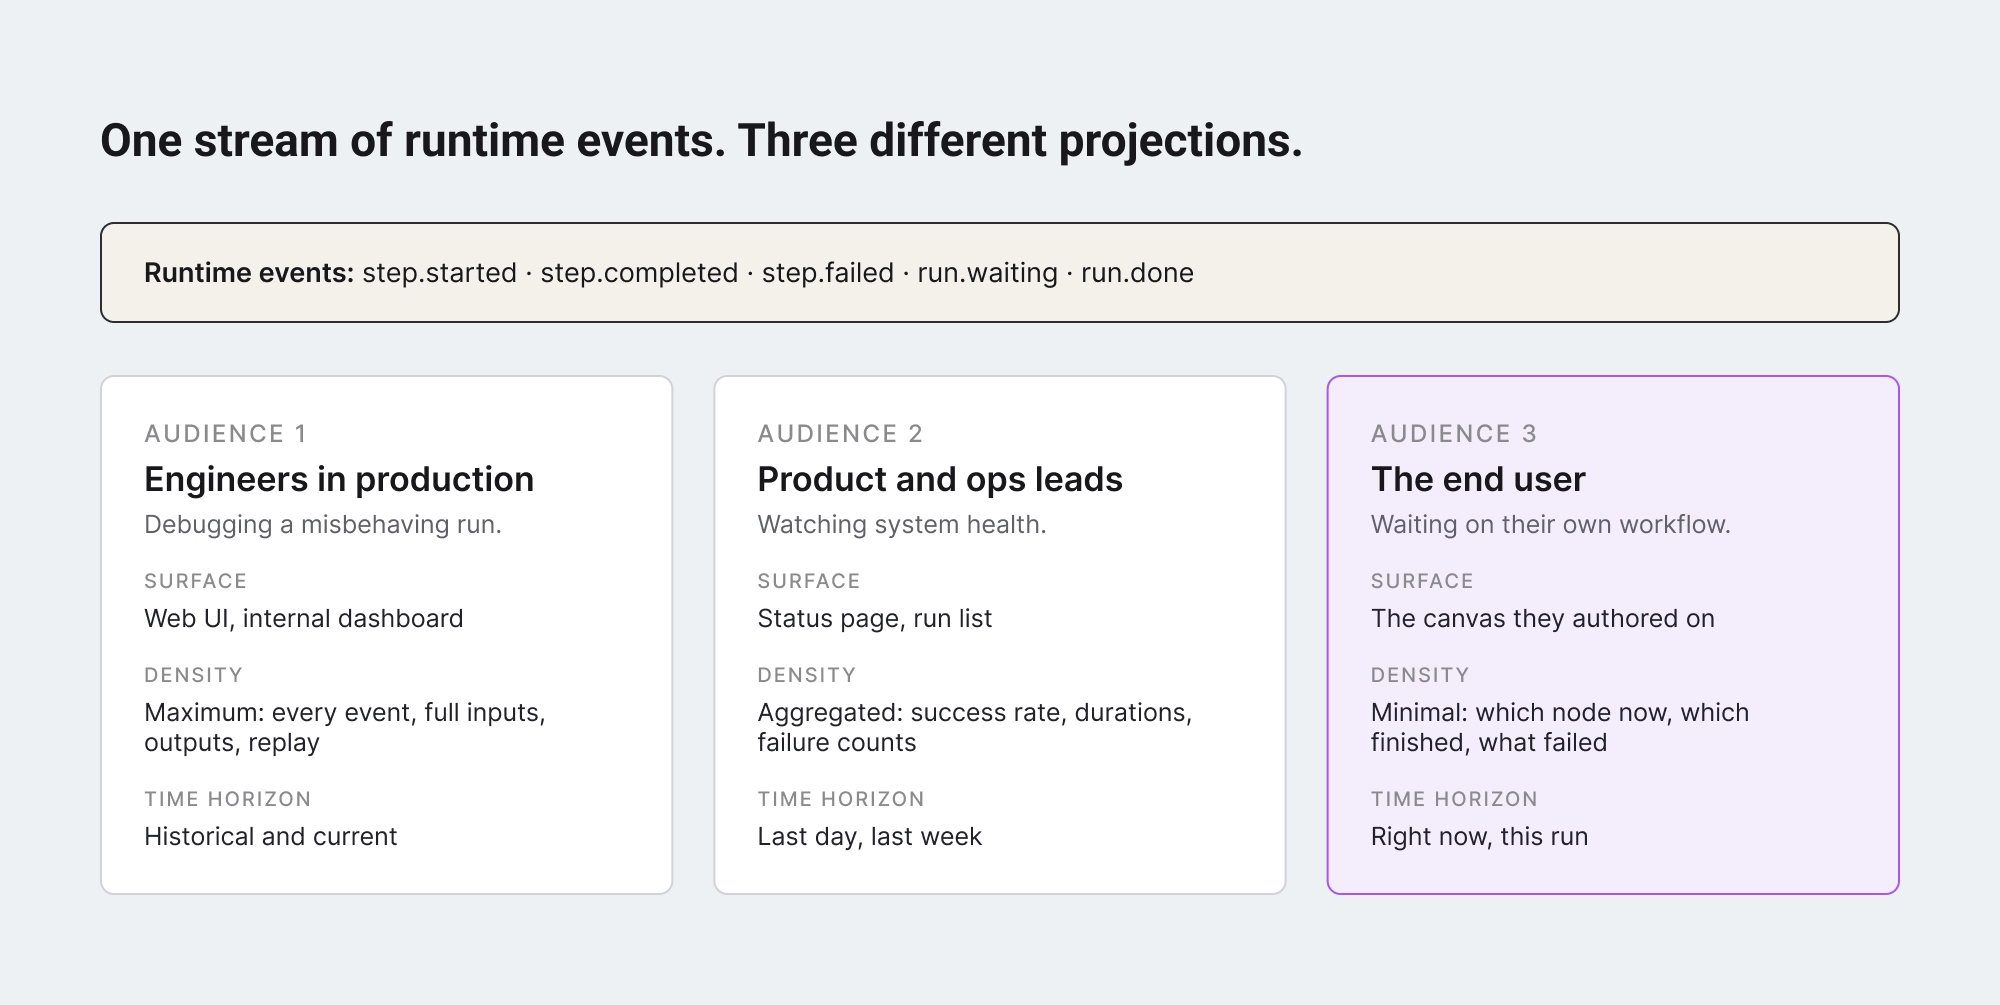
The phrase “workflow visualization” gets used for at least three different artifacts, and confusing them produces bad products. Before designing anything, the team needs to know which one they are building.
- Engineering observability. A timeline of events emitted by the runtime, queryable by run ID, with full input and output capture. The audience is engineers debugging production. The interface lives outside the user-facing product – in a Web UI like Temporal’s, or in an internal dashboard. This is the artifact that already exists in most durable execution platforms.
- Operational status surface. A list of recent runs with status badges, durations, and success rates. The audience is a product manager or operations lead who needs to know the system is healthy. Useful, but not where customers spend their time.
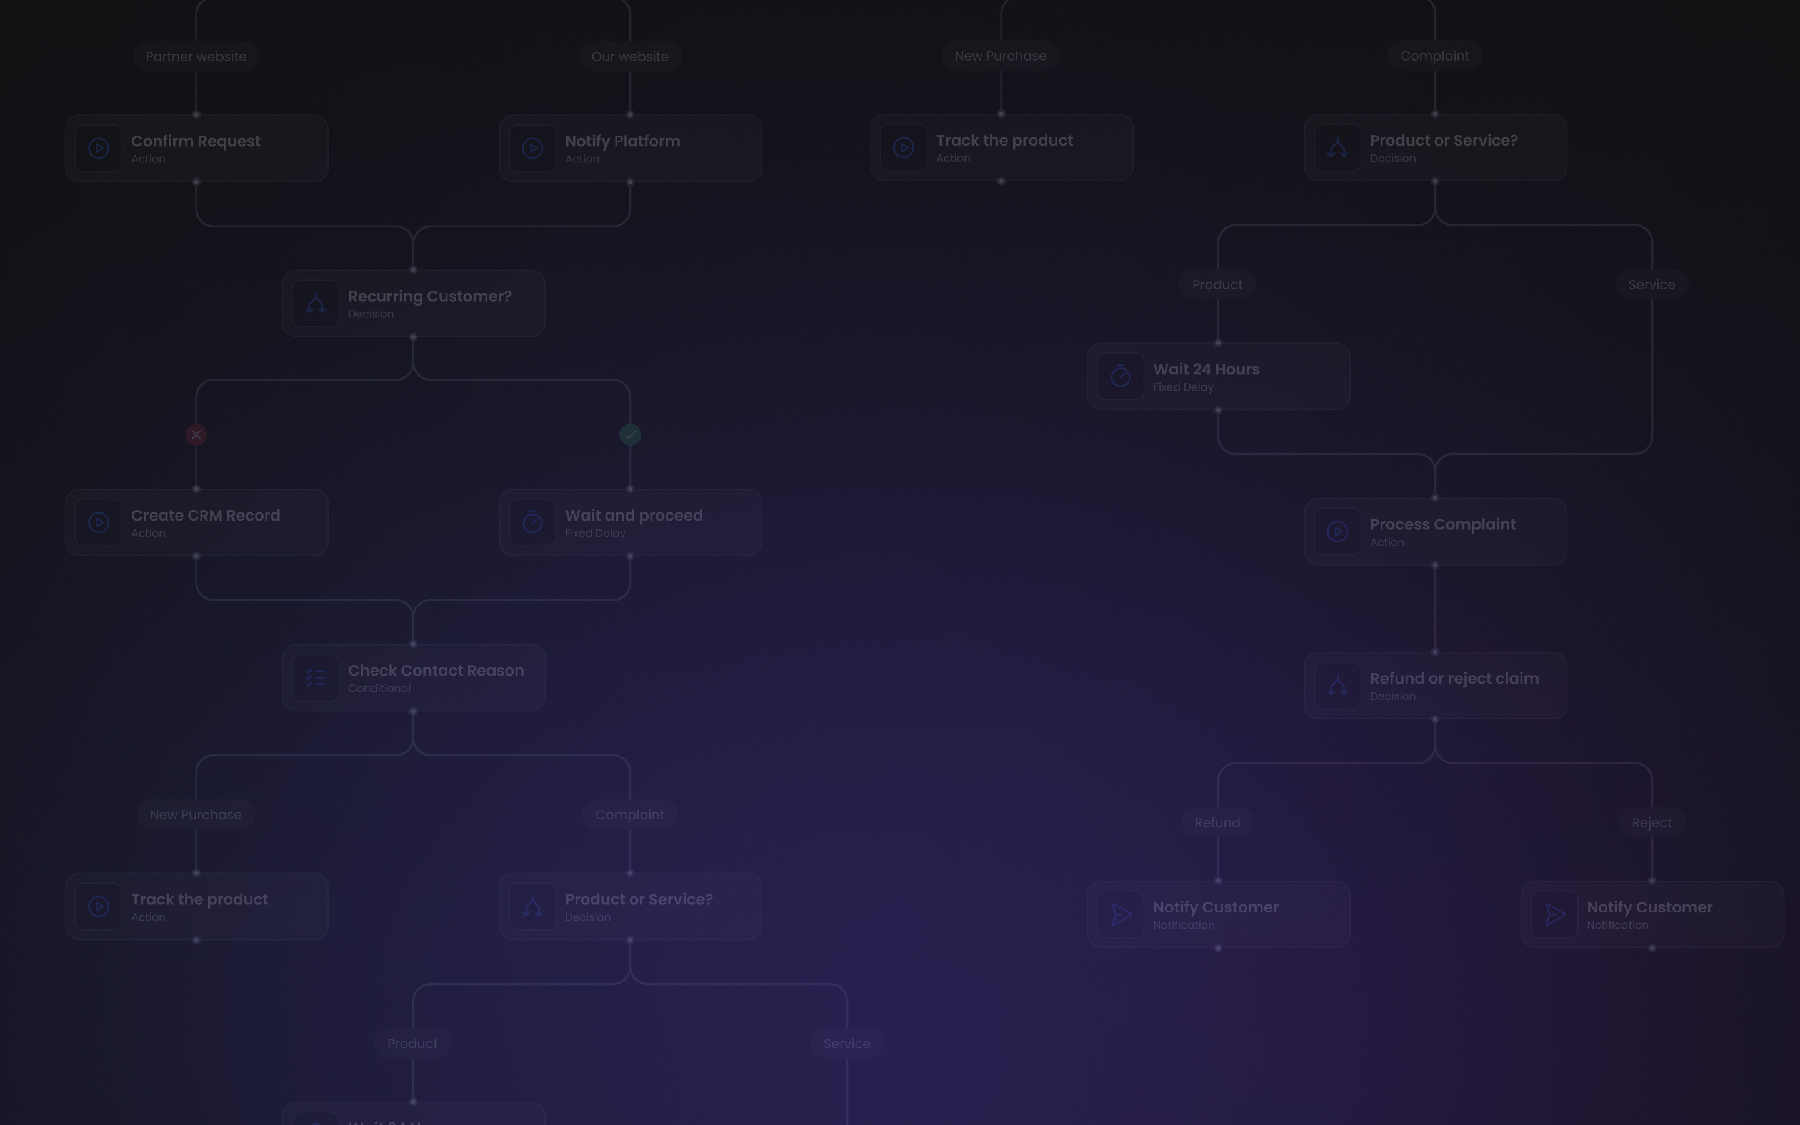
- Live on-canvas execution view. The user’s own canvas, with the running workflow projected onto it: which node is currently executing, which have completed, which are waiting, which failed. The audience is the end user – the same person who authored the workflow. This is the artifact most products underbuild, and the one that changes how customers feel about the product.
The same runtime events feed all three artifacts. The difference is in the projection – what subset of the events is shown, in what shape, with what density of detail. Designing for engineers and showing the result to end users produces a feature that nobody actually uses.
The real importance of on-canvas execution view
The argument is simple: the canvas is where the user already is. They authored their workflow there. They understand the layout, the node positions, the connections. When the workflow runs, they expect that same canvas to come to life.
Pulling them to a different surface (a separate “Runs” page, a status bar somewhere in the navigation, a notification panel) breaks the mental model. The user has to translate between two representations of the same workflow: the one they designed, and the one they are watching execute. It works, but it is friction. And friction at the moment a user is waiting on a result is exactly the moment when product trust is being decided.
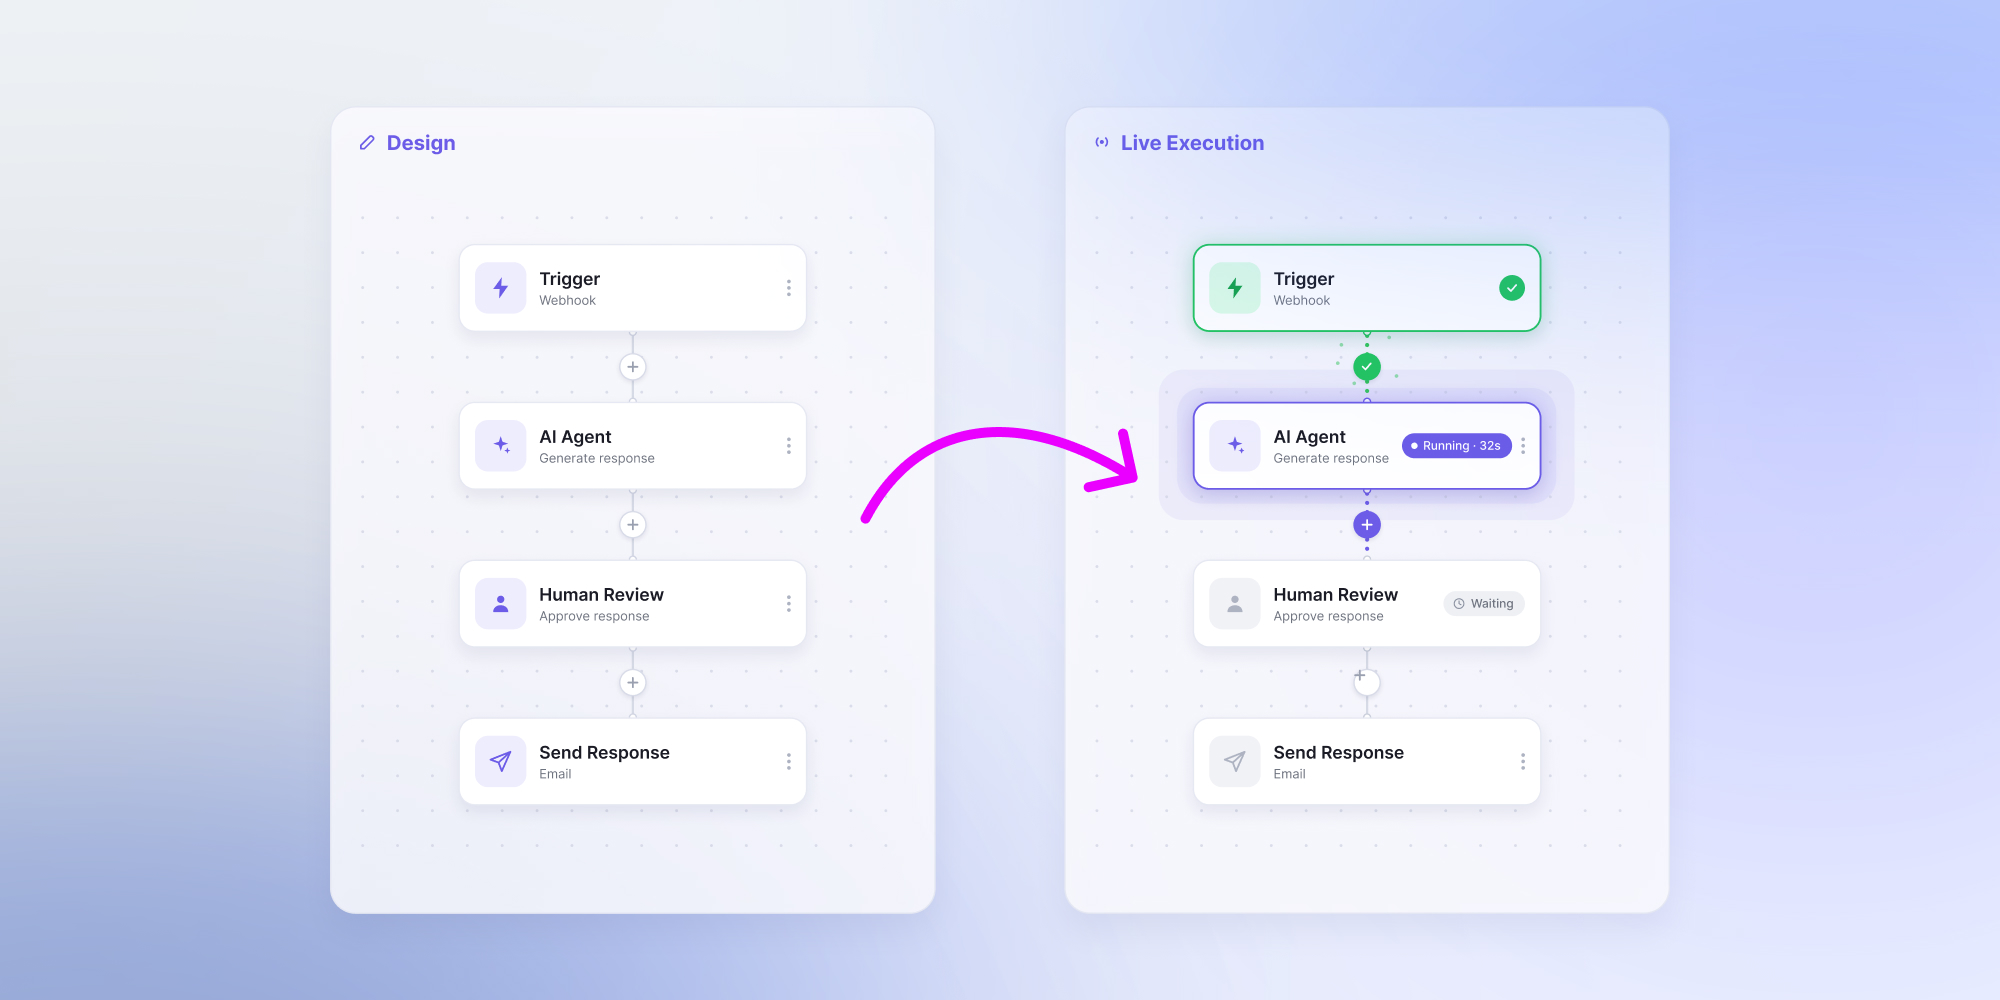
The on-canvas view collapses both representations into one. The user sees their workflow, with a running indicator on the current node, completed nodes marked, failed nodes flagged. The graph they drew is the same graph showing them what is happening. Three things happen as a consequence:
- The user understands what is taking time. If a flow stalls, they can see exactly which step is running long. They do not have to ask “what is the AI doing right now” – they can see the AI Agent node pulsing, with elapsed time visible. That information changes panic into patience.
- Failures become legible. When a step fails, the failure surfaces on the specific node, not in a generic error toast. The user can see this node, this input, this error message. They know if they should retry, edit the workflow, or escalate. The product becomes self-documenting.
- The product feels alive. A canvas with movement on it – a pulsing border, an outgoing edge that brightens as data flows along it, a checkmark appearing on a finished step – communicates working software better than any progress bar. It is the difference between “I hope this is doing something” and “I can see it doing something.”
What goes on a node during execution?
Designing the node-level overlay is where most teams either go too sparse (users learn nothing new) or too dense (the canvas turns into a dashboard). The right balance is informed by one principle: at any moment, a glance at the canvas should answer three questions – what is running, what is done, and what went wrong. Everything else is one click away.
Concretely, a node during execution carries six pieces of overlay information.
- State. The most important – running, completed, failed, waiting, skipped, queued – signaled with a visual treatment (border weight, color, or animation) that does not require reading text.
- Time elapsed. Shown for the running node, with total duration appearing on completed nodes.
- Retry count. A small indicator appears if the node retried.
- Waiting reason. A waiting node shows what it is waiting on – an event, a human, a delay.
- Failure summary. A failed node shows a one-line error summary with a click-through to details.
- Unreached nodes. Nodes that have not been reached yet stay neutral – no overlay, no clutter.
The node is not the right place for full input and output capture. That belongs in a side panel that opens when the user clicks a node, with the full event log for that step. The canvas shows shape; the panel shows depth.
The technical shape of live workflow visualization
The pattern that holds up at scale is straightforward, and the same one used by every workflow product that has gotten this right. The runtime emits events when state changes – step started, step completed, step failed, run waiting, run done. Those events are pushed to the frontend over a websocket or server-sent event channel, scoped to a specific run ID. The canvas component subscribes to that channel and renders whatever the events tell it.
Two architectural decisions matter more than the rest.
- The canvas component does not own run state. It is a renderer. State lives in the runtime; events are the contract; the canvas just reflects what the events say. This keeps the editor stateless and reusable – the same component that renders a live run can render a three-week-old archived run by replaying historical events instead of subscribing to a live channel. The user gets the same visual experience for both.
- The event schema is a public contract. Every consumer of the events – the canvas, the side panel, the run list, any internal dashboard – depends on its shape. Changing the schema breaks all of them. Versioning the event format from the start, and treating it as a first-class API of the workflow product, is the difference between a feature you can extend and a feature you have to rebuild every two years.
Edge cases that separate good visualization from frustrating visualization
Live execution view has a handful of edge cases that, handled poorly, make the feature worse than not having it at all. Three are worth designing for explicitly.
- Long-running steps that look frozen. An AI Agent node that takes ninety seconds to call an LLM and return a structured response will, by default, look identical to a hung node. The fix is showing elapsed time on the running node – not just a spinner – so the user knows the runtime is alive even if the step is slow. For very long steps, an estimated duration (where one is known) helps even more.
- Branches that did not run. A workflow with conditional logic has nodes that get skipped on any given run. Showing those nodes with no overlay at all reads as “not yet reached” – confusing if the run is already complete. The fix is an explicit “skipped” state, visually distinct from “not yet reached,” so the user understands the conditional took the other branch.
- Resumed runs after a crash. If the runtime crashes and resumes, the canvas needs to handle the gap gracefully. The events from before the crash are replayed; the canvas should not show them as new running steps but as historical state. This usually means tagging events as either live or replayed, and treating replayed events as instant state updates instead of animated transitions.
What this changes for the workflow product
For a SaaS product embedding a visual workflow editor, live execution visualization is the feature that converts the editor from a design tool into a workflow product. The user does not just author a flow and hand it off – they author it, watch it run, and intervene when something goes wrong, all in the same place. The canvas they spent time learning becomes the canvas they spend time using.
The investment is real. Designing the event schema, building the channel, instrumenting the runtime, designing the node overlay, handling the edge cases – none of it is glamorous engineering, and most of it is invisible until the day a customer says “I can see exactly what my workflow is doing right now, and I have never been able to do that before in any tool I have used.”
That sentence is the product. The canvas is what makes it possible.
Workflow Builder is an embeddable workflow editor SDK by Synergy Codes. Version 2.0 ships with a packaged SDK and a reference execution backend on Temporal, including live on-canvas execution view that projects runtime events onto the same canvas users author on.
Principal Developer with 7+ years of experience in React. He specializes in building data visualization solutions and interactive diagramming interfaces. He combines technical expertise with a business focus to develop practical, high-impact applications.


Go further with Overflow and Workflow Builder
Workflow Builder is powered by Overflow — a library of interaction components made with React Flow that elevates and extends node-based interfaces.